For the first graphs, I’ll compare the most left-leaning state’s performance to that of the most right-leaning one during the beginning of the pandemic, as well as the most neutral state. Although it’s not useful for making any inferences, it’s just interesting to see which state performed better.
According to worldpopulationreview, Hawaii is the most liberal state, Wyoming is the most conservative state, and Oregon is the most neutral. I’ll use these for my comparison.
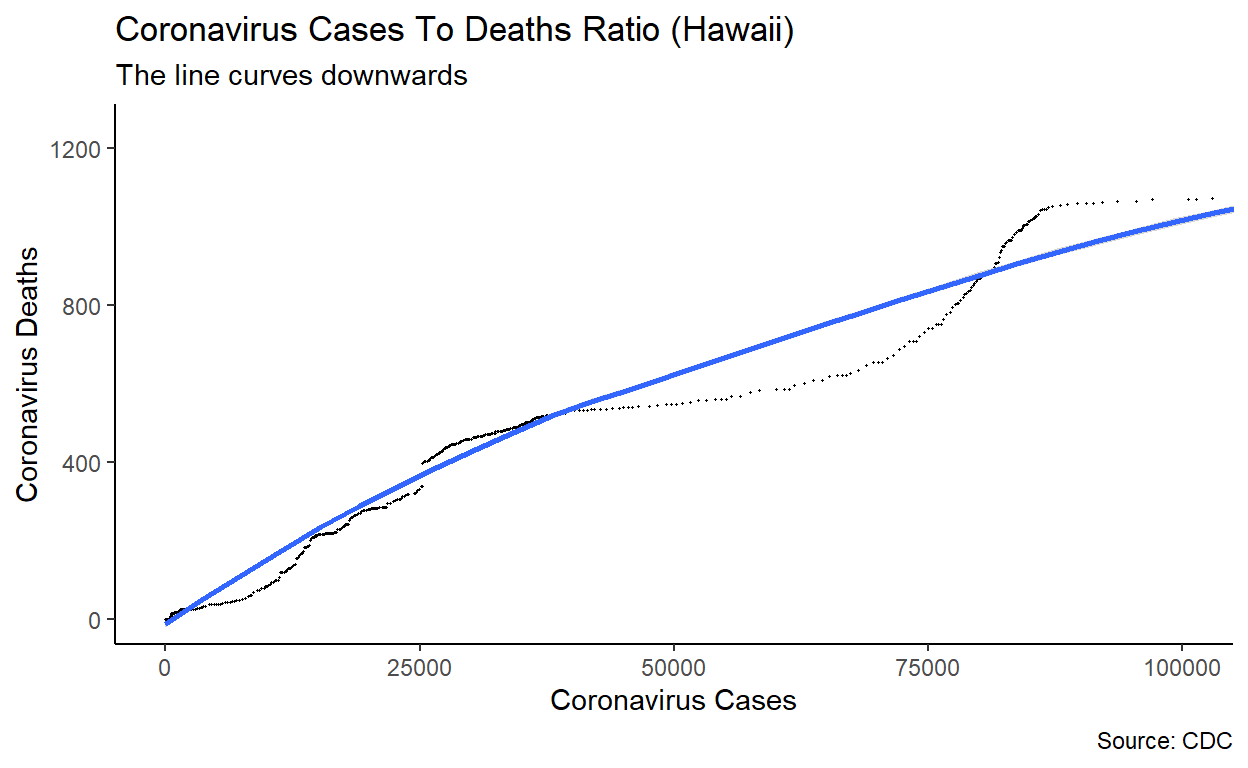
The graph shows that Hawaii’s cases have started to peak, and the line may eventually go down.
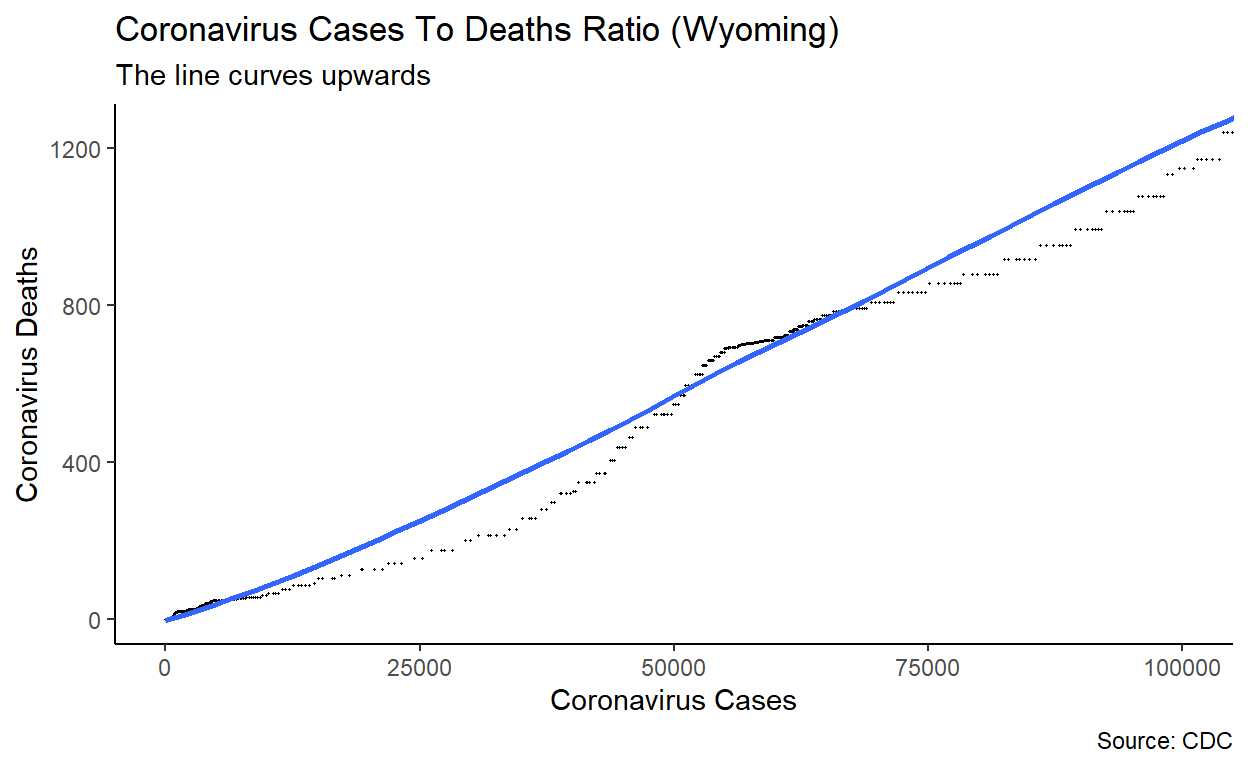
Here, you can see that the line curves upwards, and shows that the cases for Wyoming are increasing.
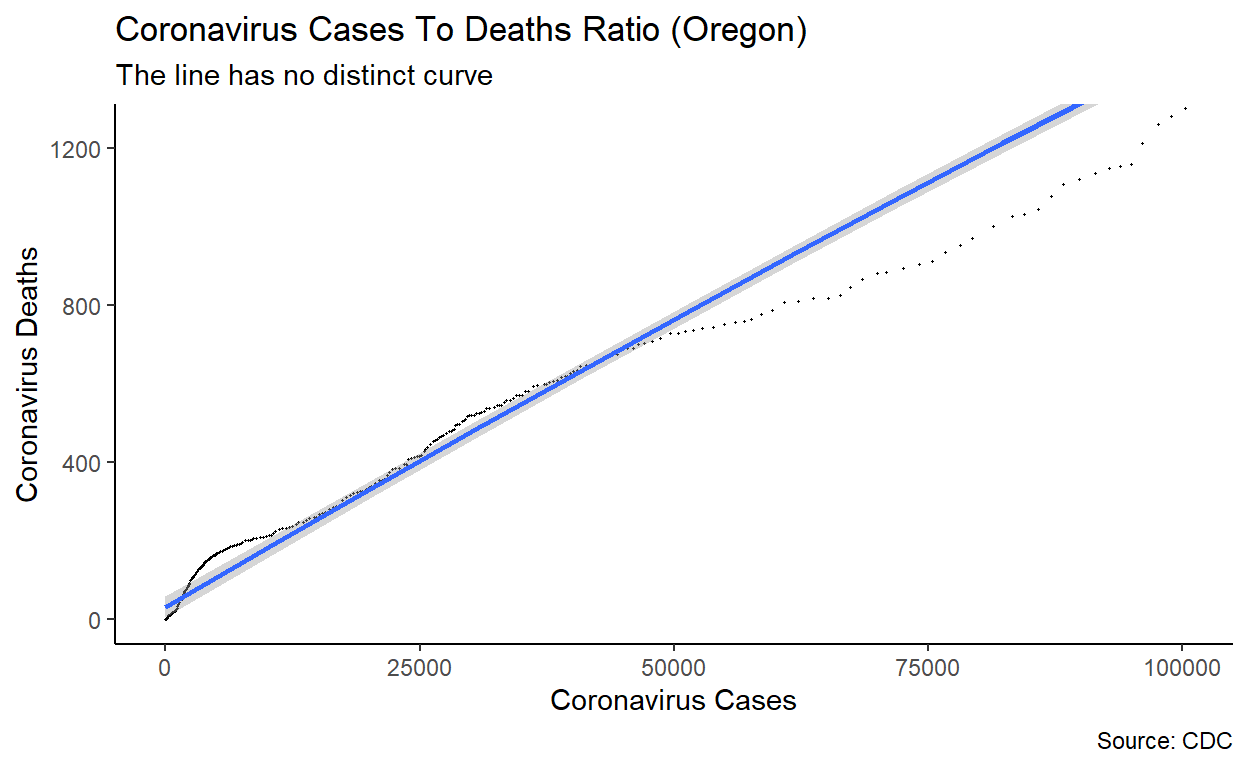
Lastly, this is the data for Oregon. Oregon is split evenly, with 30% of the population being conservative, and with another 30% being liberal. Most people would expect Oregon’s cases to be in between that of Hawaii and Wyoming, but Oregon has the most cases out of all three!
Analysis
The two graphs show that Hawaii did slightly better than Wyoming at the start of the pandemic, as it had less deaths with the same amount of cases as Wyoming. However, Oregon has more cases than both of those states, which is unexpected, as most people would have expected it to have COVID-19 cases that were in between Hawaii and Wyoming.
(Disease Control and Prevention 2022)