Something that I rarely see explored in the context of COVID-19 is how prediction models and AI are used to predict the number of probable cases. For the states, I chose California, Massachusetts, Michigan, and Wyoming. The data is from the CDC, and the number of cases is for Christmas 2021. The results are surprising!
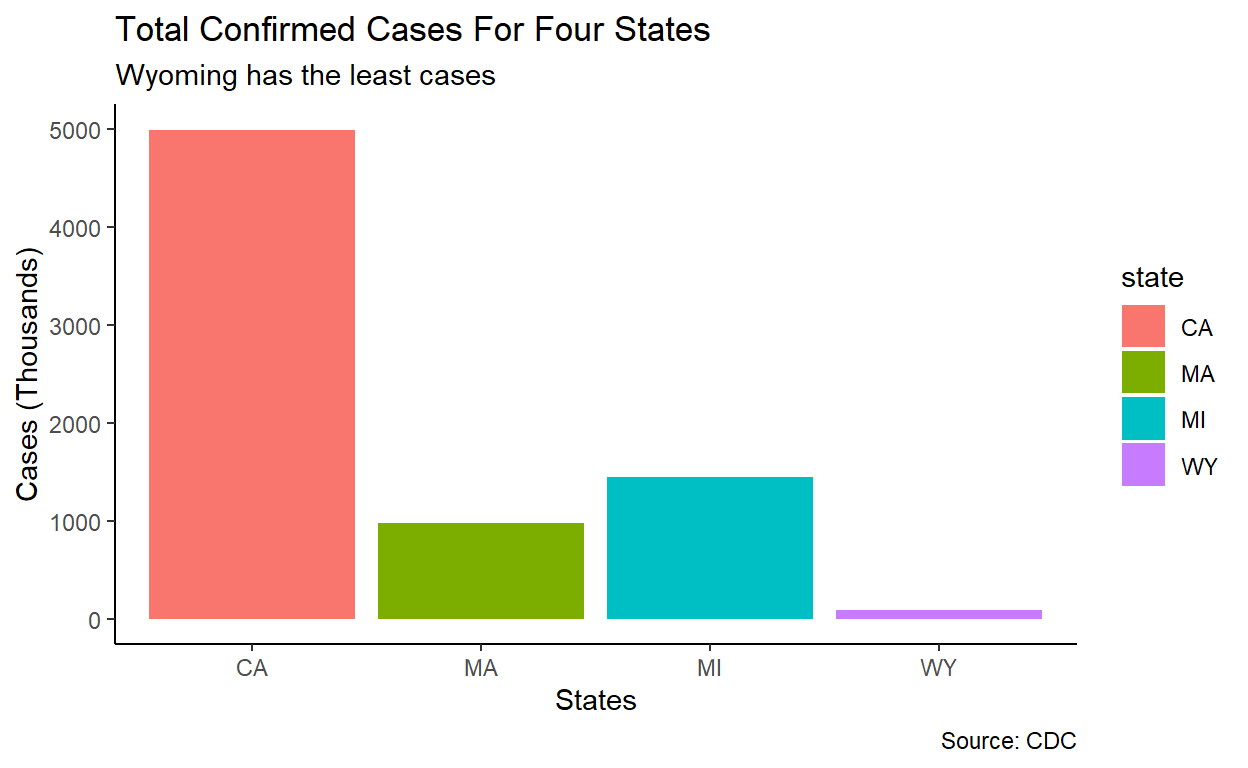
The graph above shows the confirmed cases for four different states for Christmas 2021.
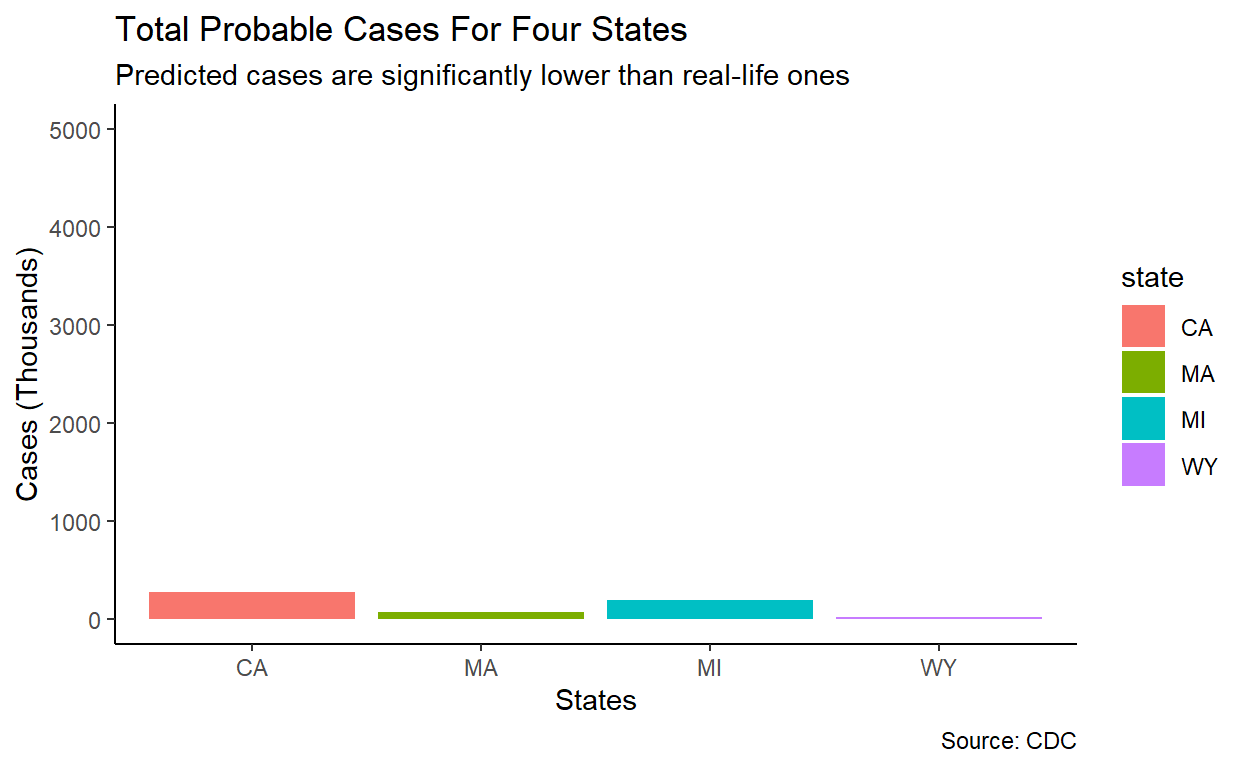
Here, the graph shows the probable cases for the sames states, on the same day. Again, the date is for Christmas 2021. See the massive difference?
Analysis
As you can probably see, the graphs show that the probable cases aren’t exactly very accurate. In fact, they’re off by thousands of cases! This shows that our predictions can use some improvements. Additionally, the data was taken from Christmas 2021, when cases were expected to grow greatly. Because analysts expected spike during a major holiday and still underestimated the number of cases, it’s reasonable to expect that our predictions would usually be much lower than the actual cases.
(Disease Control and Prevention 2022)